
On this page
When you really break it down, helping buyers buy is really what your marketing site is all about, right?
That’s certainly how we think about things here, at Content Camel. And it was obvious after many sales calls that a pricing calculator would be helpful – even though we have standard pricing (which is pretty rare in the sales enablement space).
On average, B2B buyers consume up to eight vendor-created pieces of content and five third-party pieces before making a buying decision, according to research by FocusVision. That content includes videos, blog posts, whitepapers, analyst reports, testimonials, and reviews.
Building a free pricing calculator falls into the category of building marketing tools like quizzes and spinny widgets.
And, honestly, that usually takes a lot of tech talent that most marketing teams – small or large – don’t have.
We wanted to launch our product price calculator quickly with the least effort possible, so that we could iterate over that and be agile with marketing.
Here’s the final result:
Oooh, look at that. Just minutes of work and done 👏. We might not win any awards, but it’s certainly going to make it easier for prospects to figure out how much they’d spend on Content Camel. You can check out the pricing calculator in action over on the pricing page.
So how’d we make that calculator in record time? Google Data Studio.
The tools you already know
First, Google Data Studio is a tool that’s probably already in your toolbox as a marketer. Or, you’re certainly familiar with Google Analytics – the original use-case that spawned Data Studio.
So, yeah, we thought - why not build with what we already know?
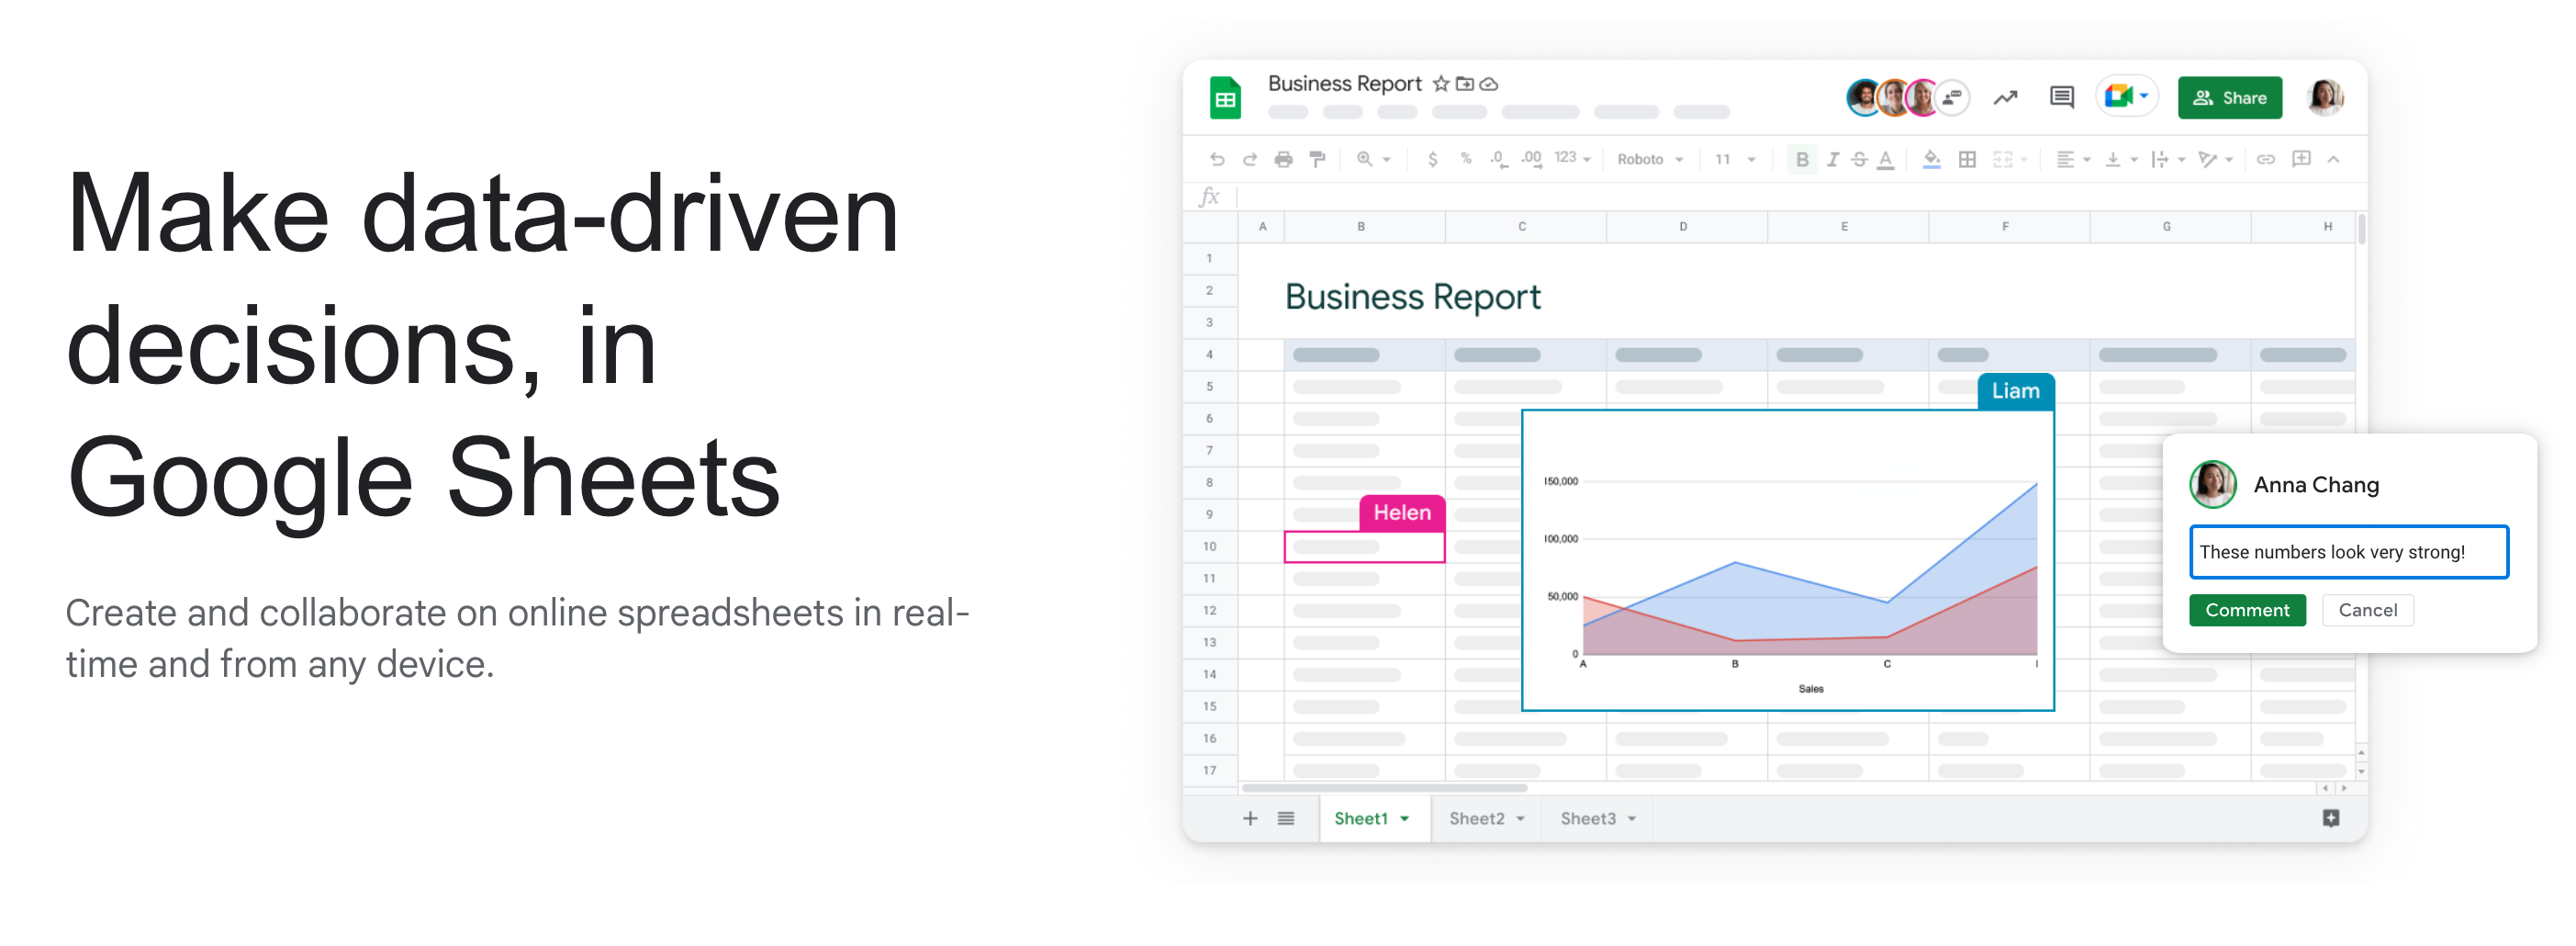
Of course that was after experimentation with our first go-to Google Sheets. You can format sheets to have big fancy numbers and remove the data grid and even embed the sheet in a website, but there’s only one “version” of the sheet.
So the downfall there is that when a viewer changes the values, then it’s changed for everyone.
So, that wouldn’t work. We needed something flexible and fast and fit this basic criteria:
- Can be built by the marketing team without any developer time
- Doesn’t look awful
- Can calculate our pricing (of course) - so some flexibility with rules
- Can be embedded on the website and interactive for the visitor
That’s about it. We didn’t go the fullblown html, css, javascript route, because our team is tied up working on the next versions of our product, and we don’t – at the moment – have spare tech resources in our marketing department.
Building the product price calculator
I think there are ton of things that this approach could be used for, but here’s the step-by-step how we created the pricing calculator.
1. Create a new report
For brevity, we won’t go through the sign up process and all of that, so just log into your free Google Data Studio account.
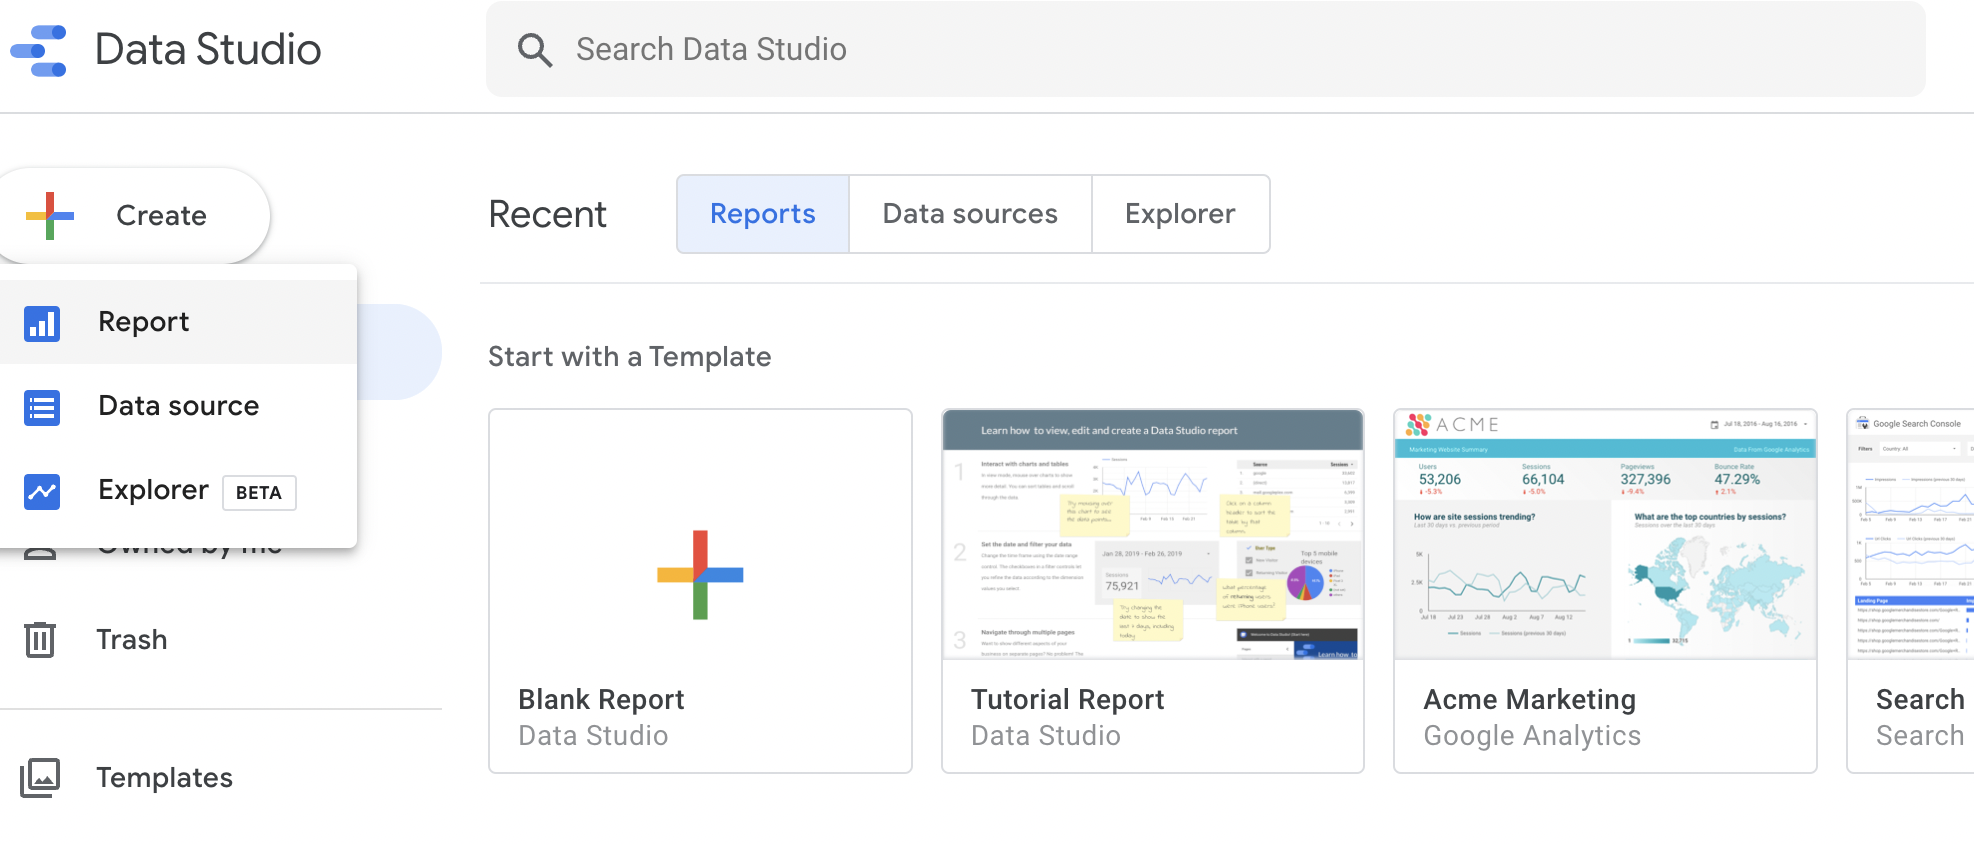
- Click
Createand selectReport.
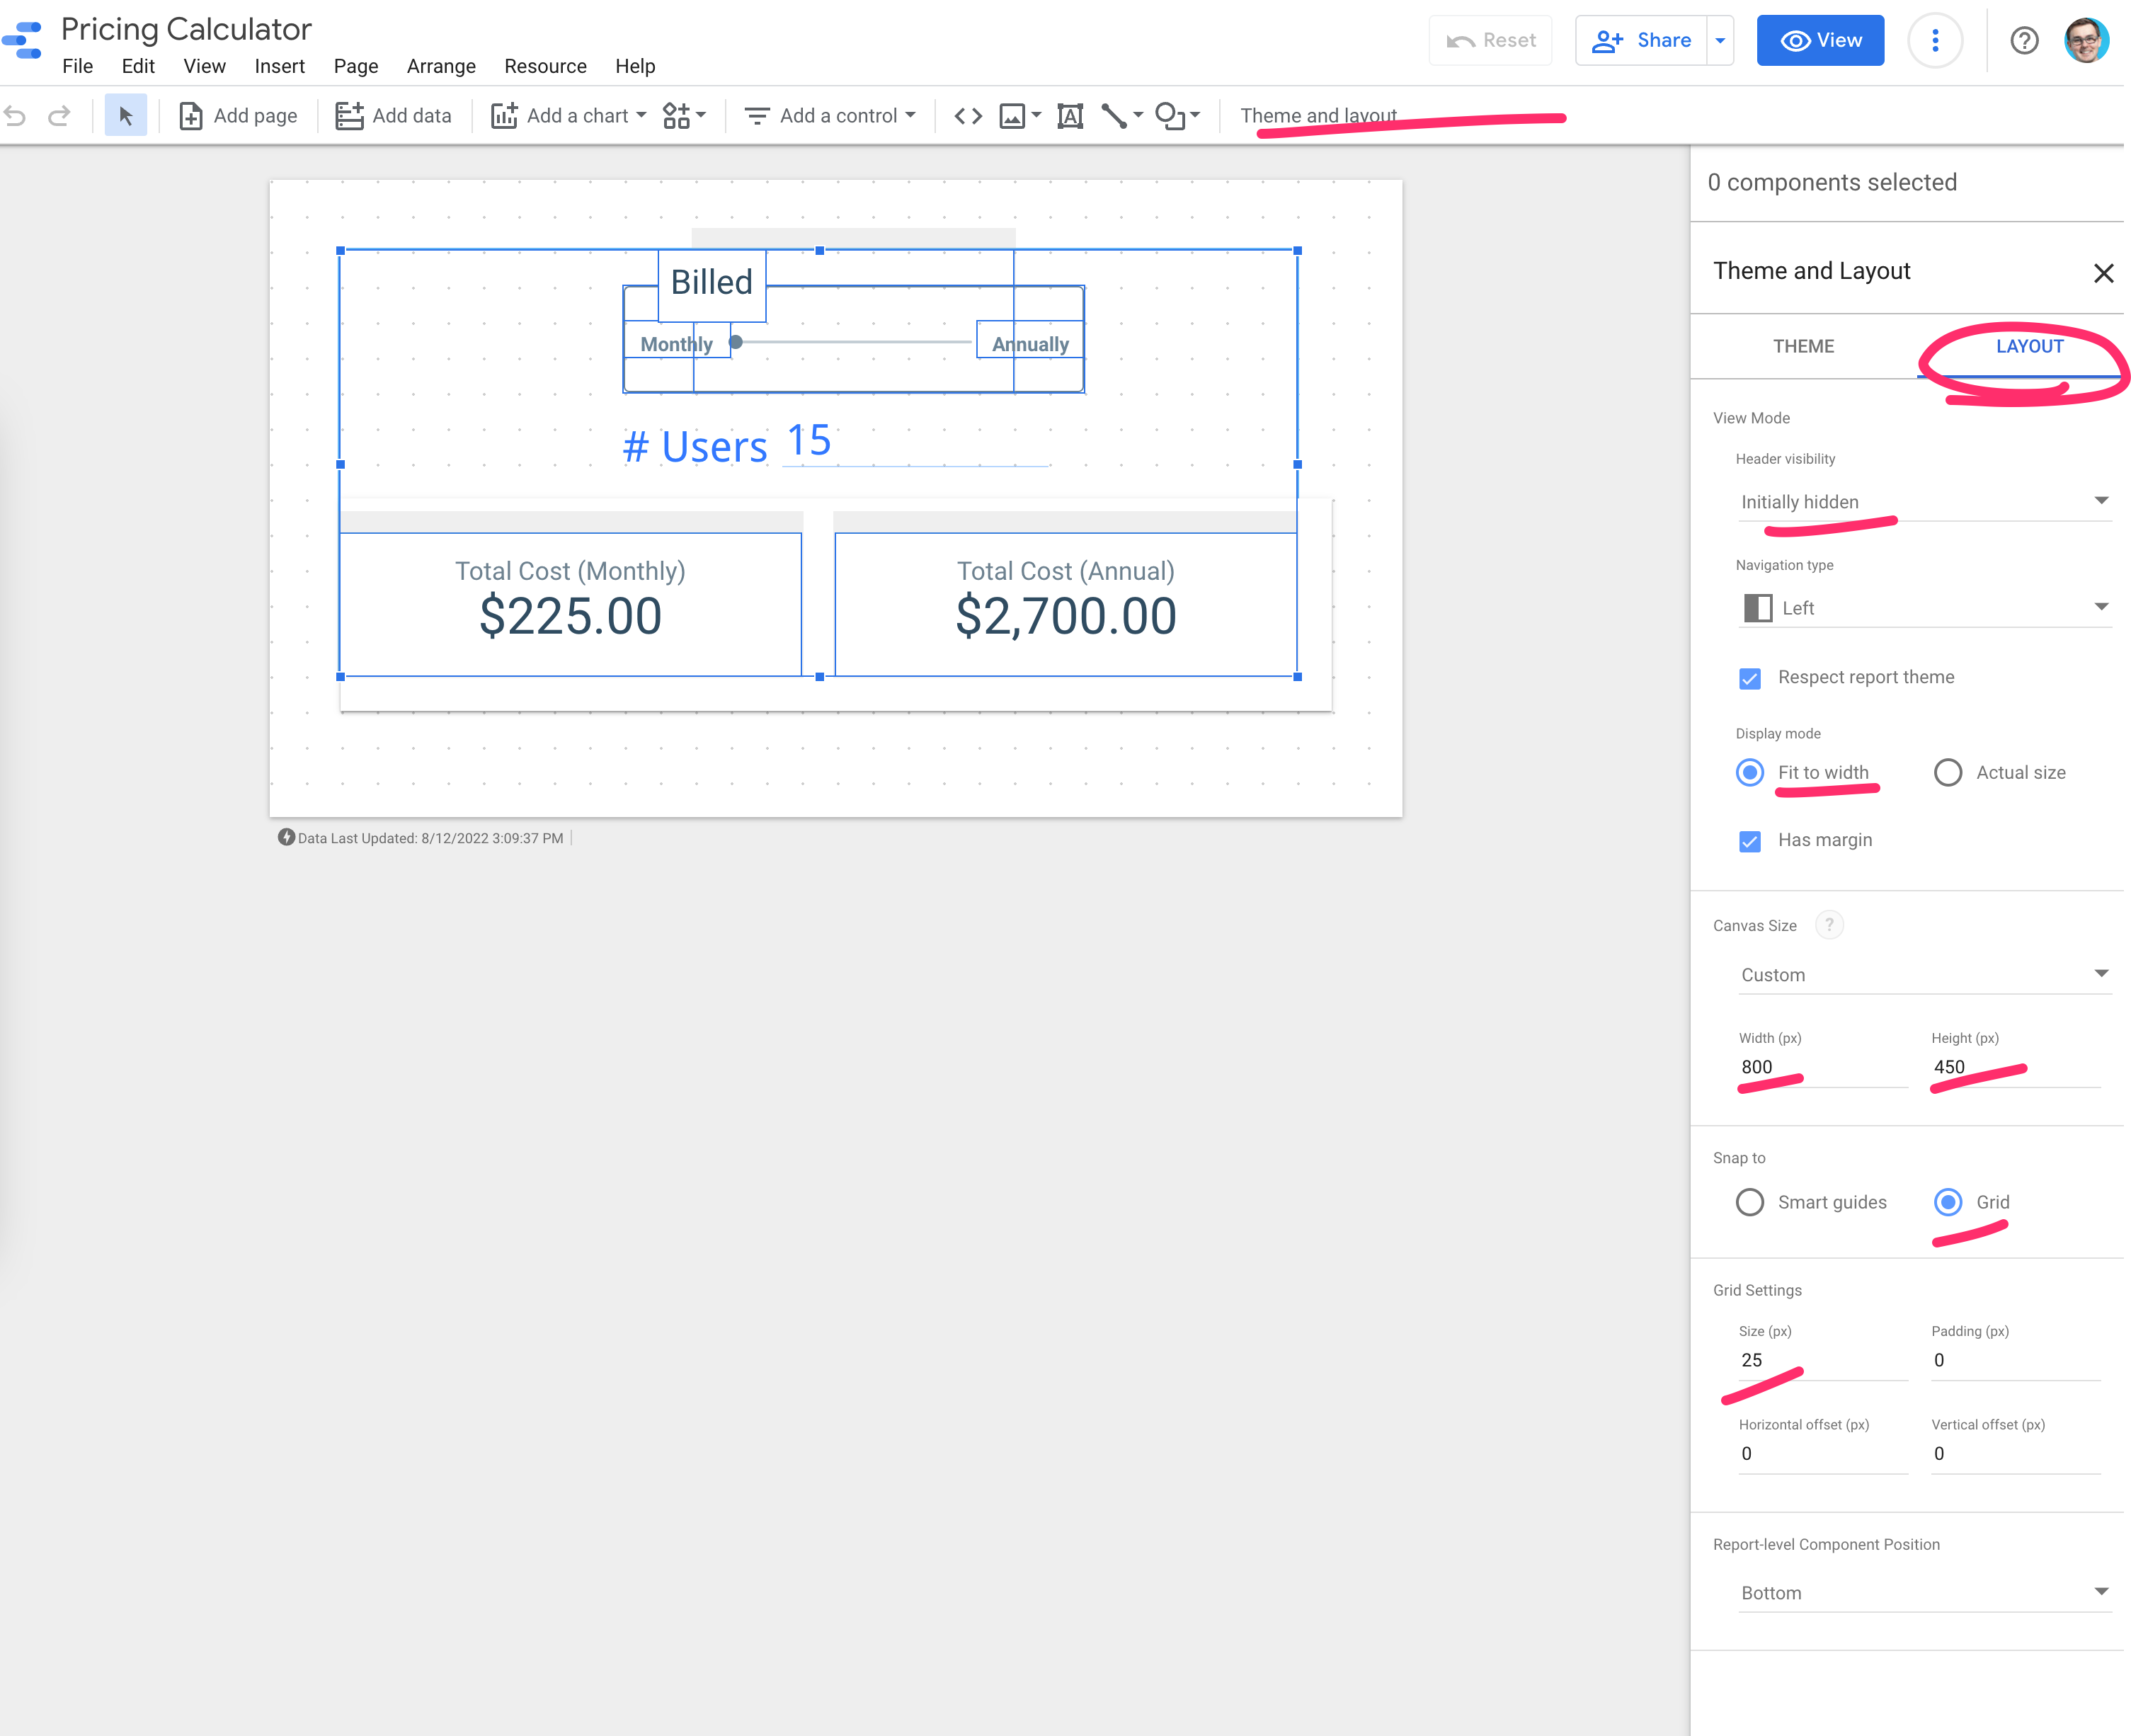
- Set the report layout parameters, so that it will play a bit more nicely with your website and responsive layout. We decreased the grid size and snapped to grid to make the layout a bit more uniform.
2. Add some controls as inputs
We originally added in a Google Sheets data source, but we actually didn’t end up using it. I’m not sure a data source is even required, but if it is - then you can add an empty sheet. The original plan was to pull the pricing values from the sheet, but we ended up just adding the rules to the formulas in the report.
Parameters are just values that the viewer can interact with. Like form fields.
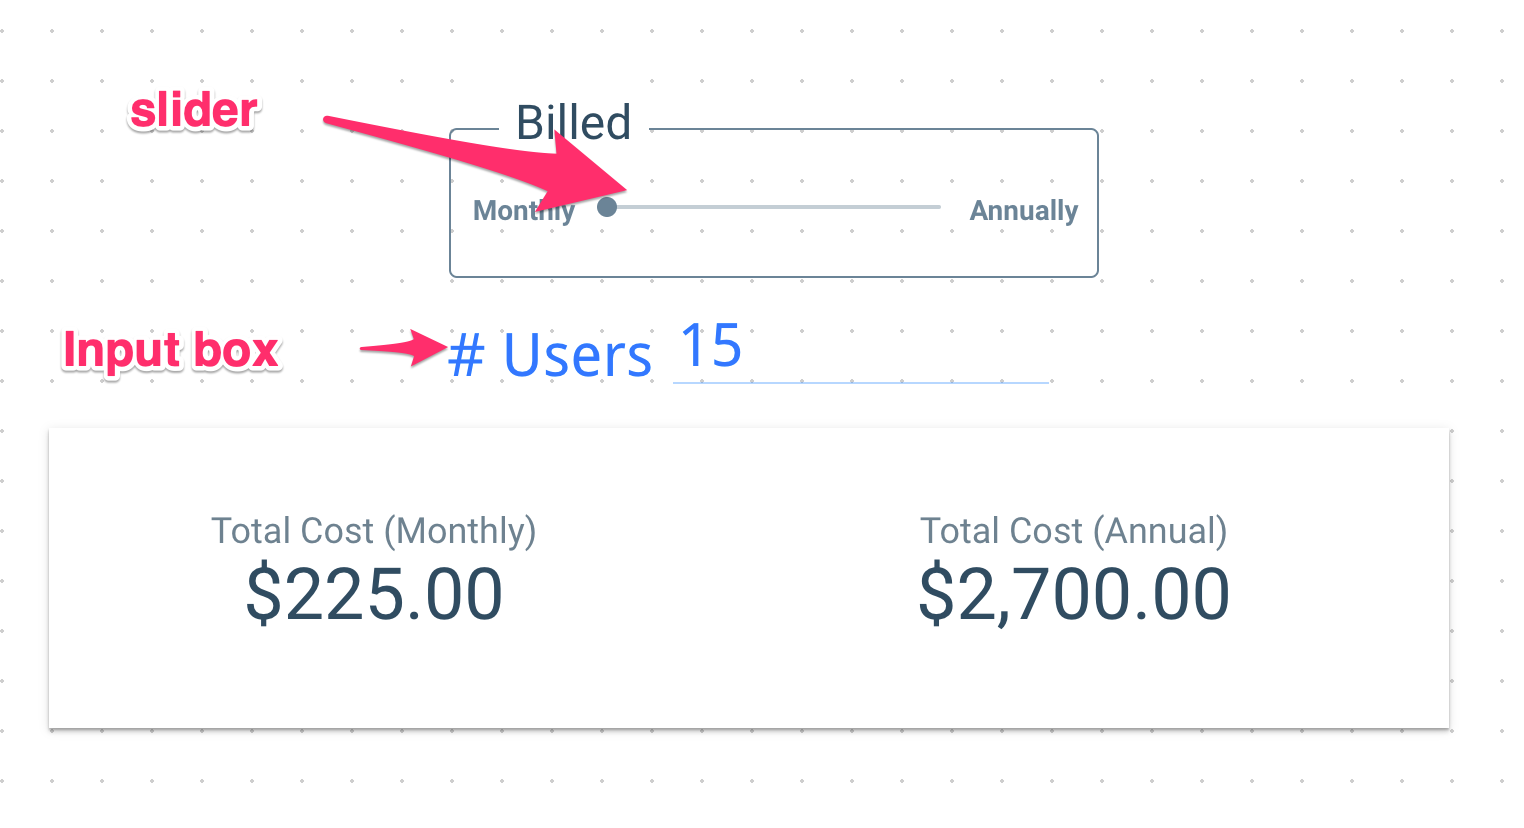
- Create parameters for the inputs. In our example that’s the billing plan scheme (monthly or annual) and the number of users for pricing
- Add the parameters as control fields for the controls that you’ve added (slider, input box)
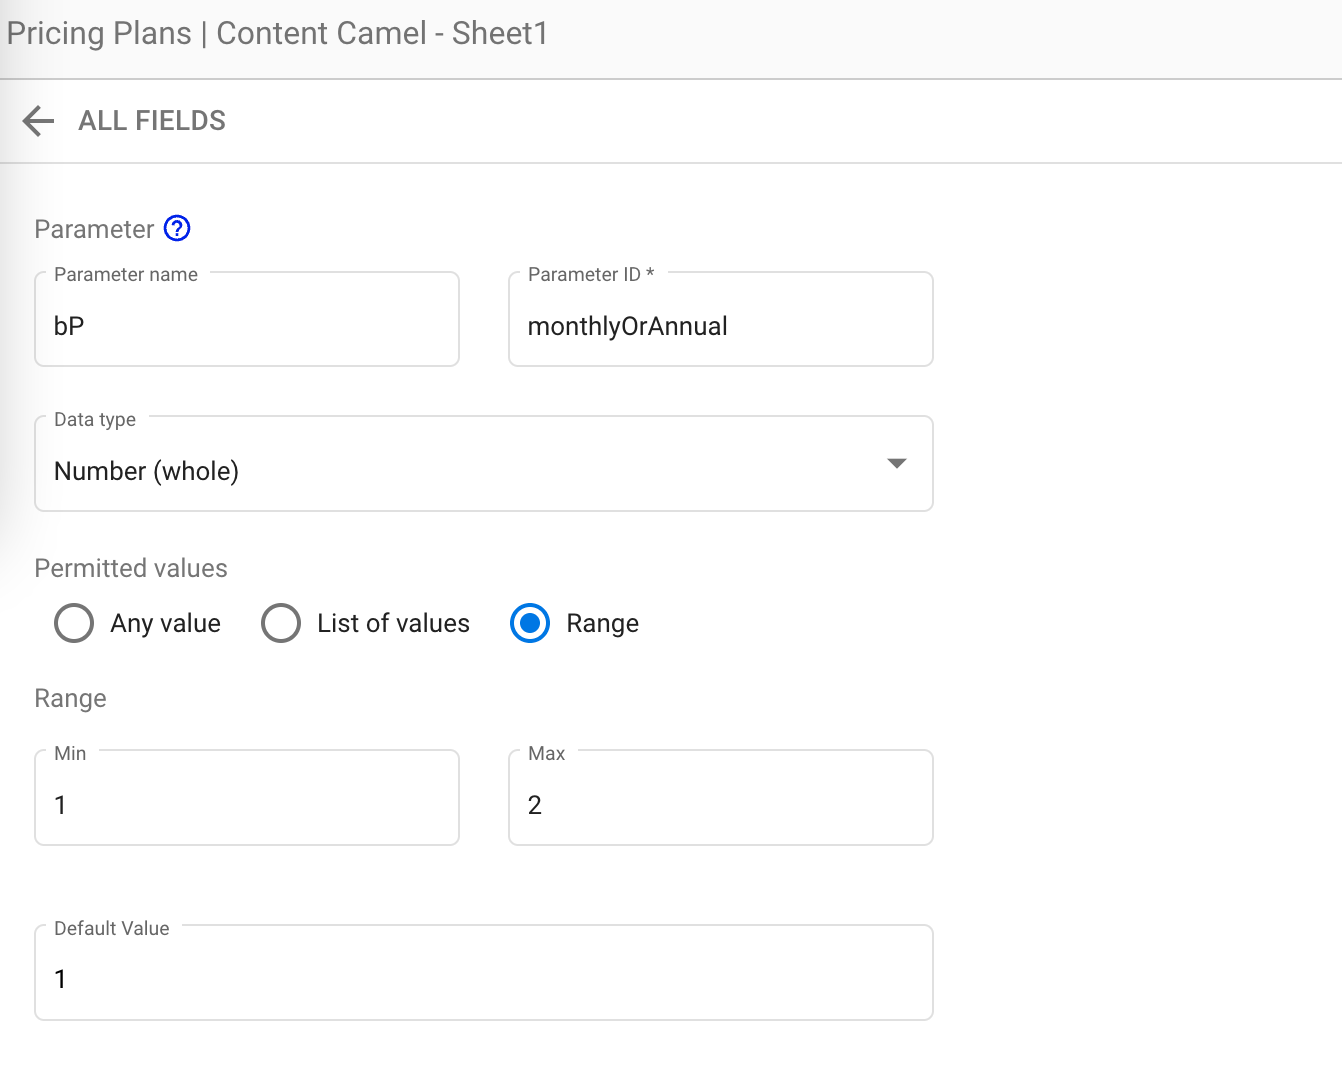
The slider was the trickiest part to get correct. Here’s how we have it configured:
3. Add charts and formulas to show calculated values
Now, with the user inputs flowing in, we just need a way to run our pricing calculation and show the results.
So we simply configure formulas as fields to store the results and add some scorecard charts to show that to the viewer.
- You can use basic formulas like in Google Sheets to get your pricing accurate and calculated the way that you want. I’m sure a smarter version of this could pull values from Google Sheets as a lookup
- Conditional logic here (IF) helps us show 0 if there’s no input and helps us switch between monthly pricing and annual plans
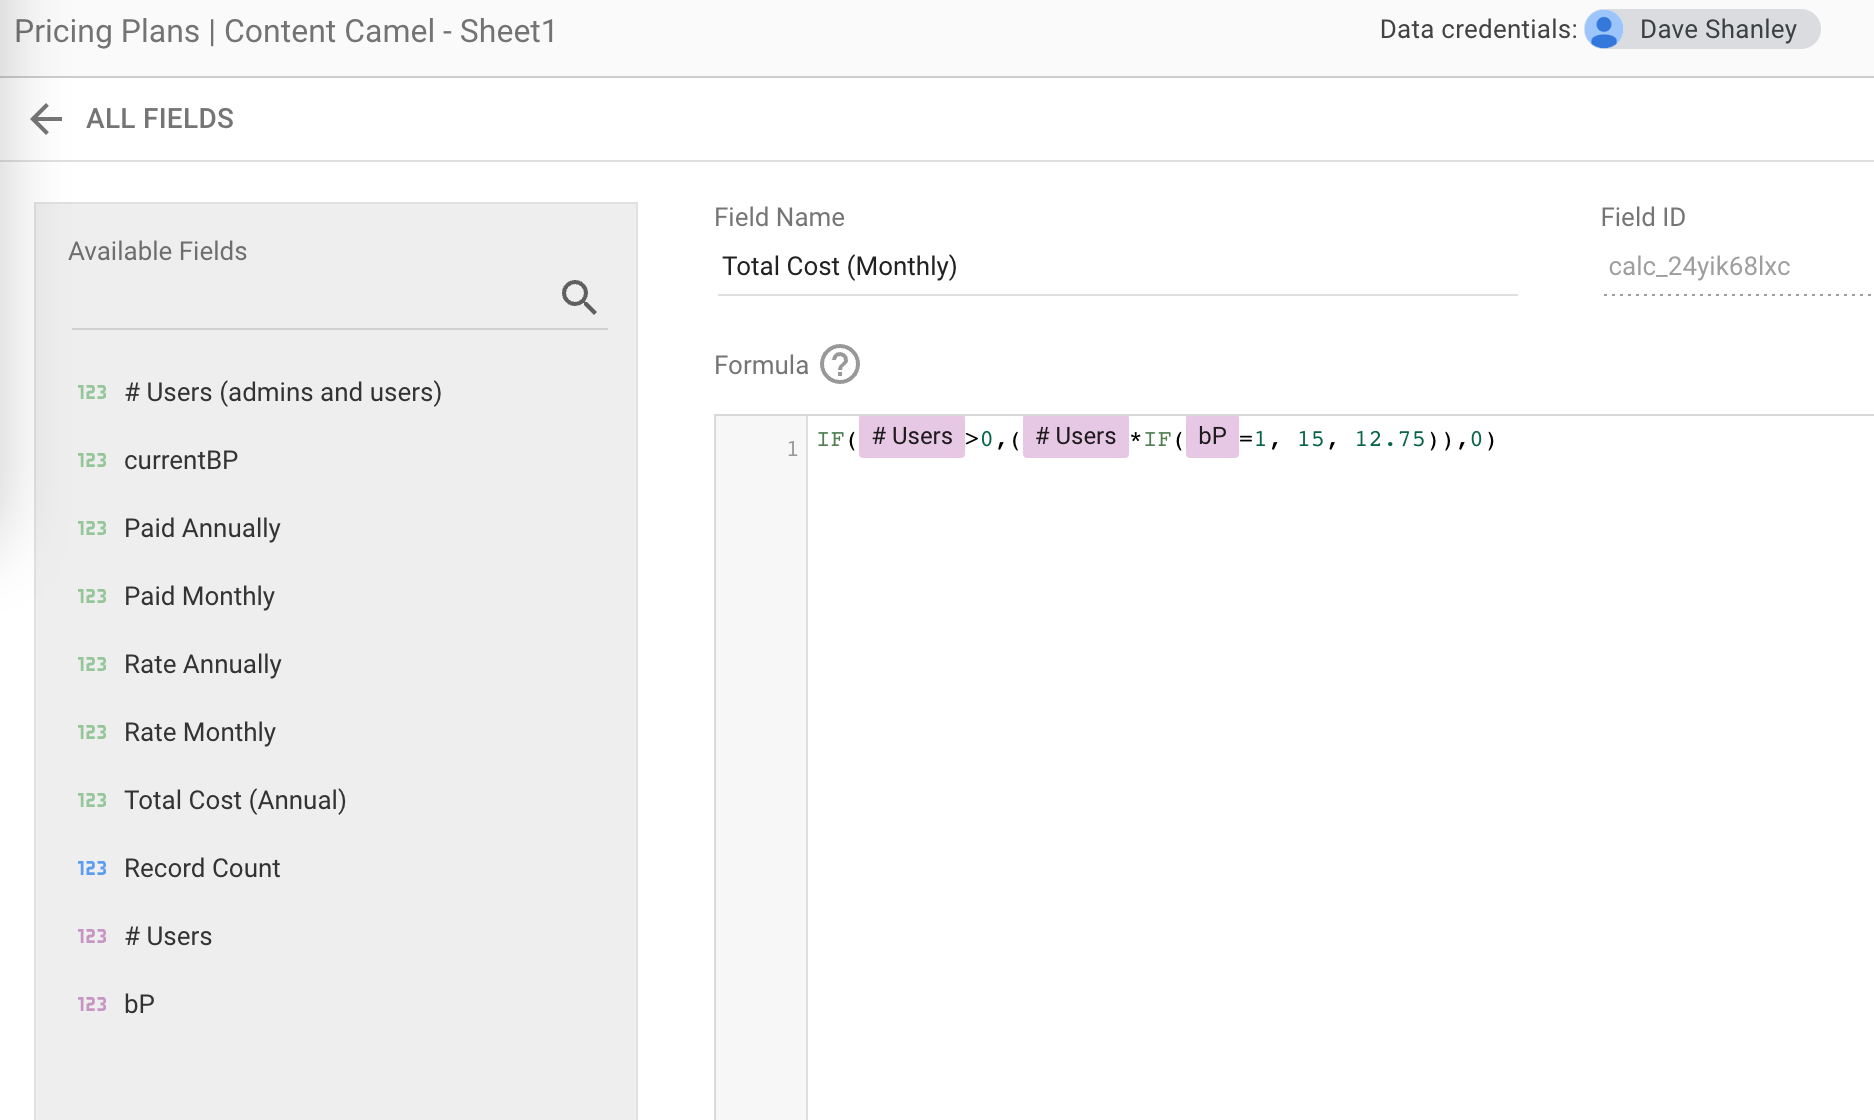
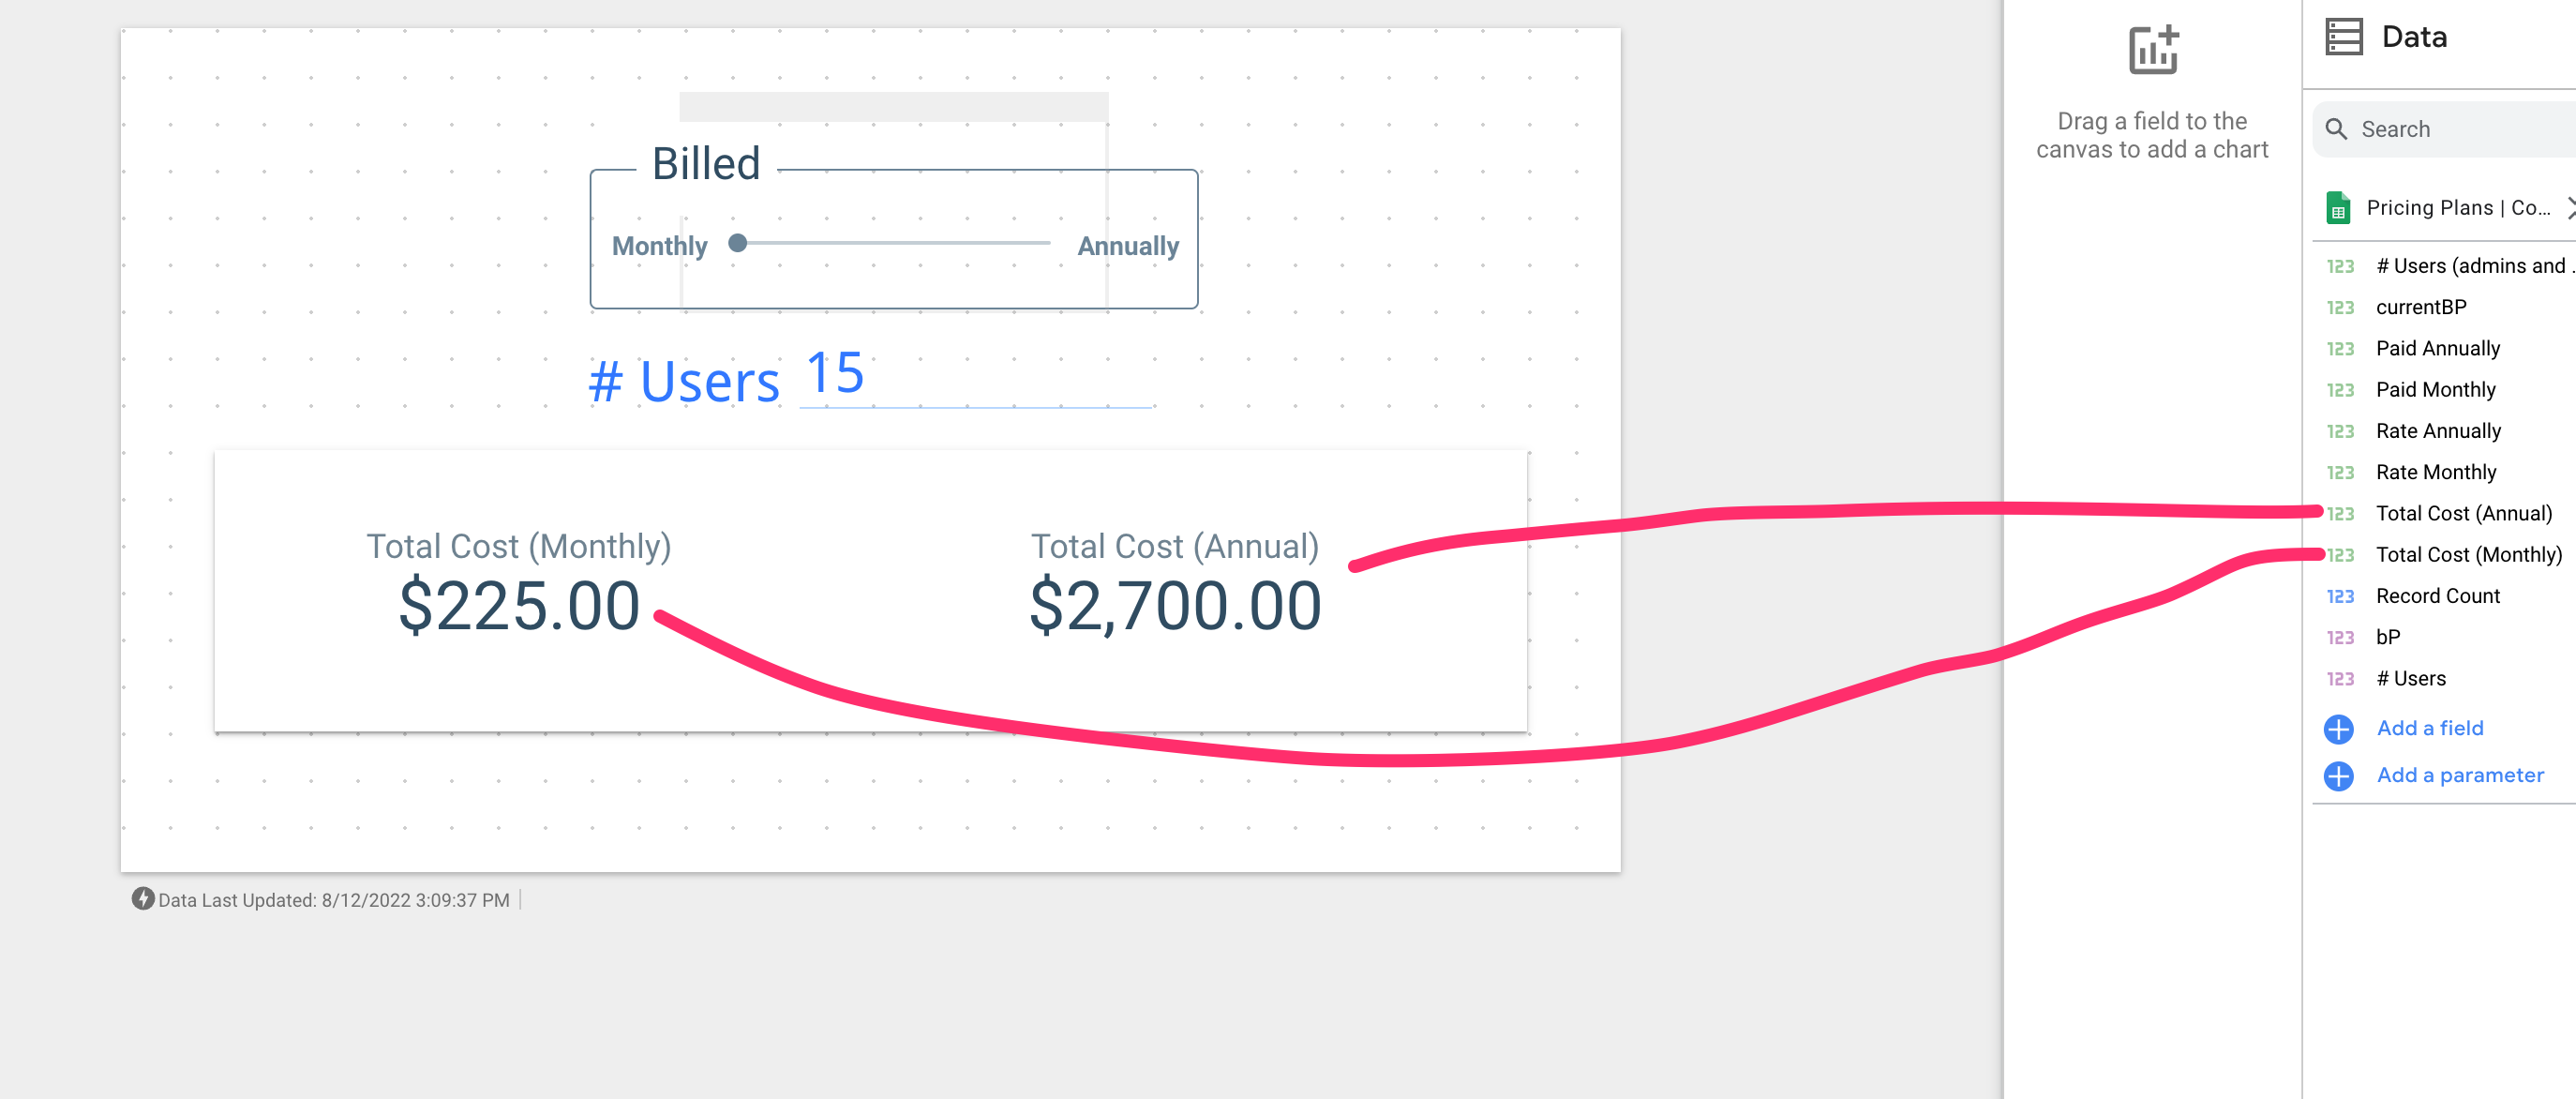
We calculate the monthly cost and the annual cost and store that in two fields, so that we can show both to the prospect.
Group input controls and charts
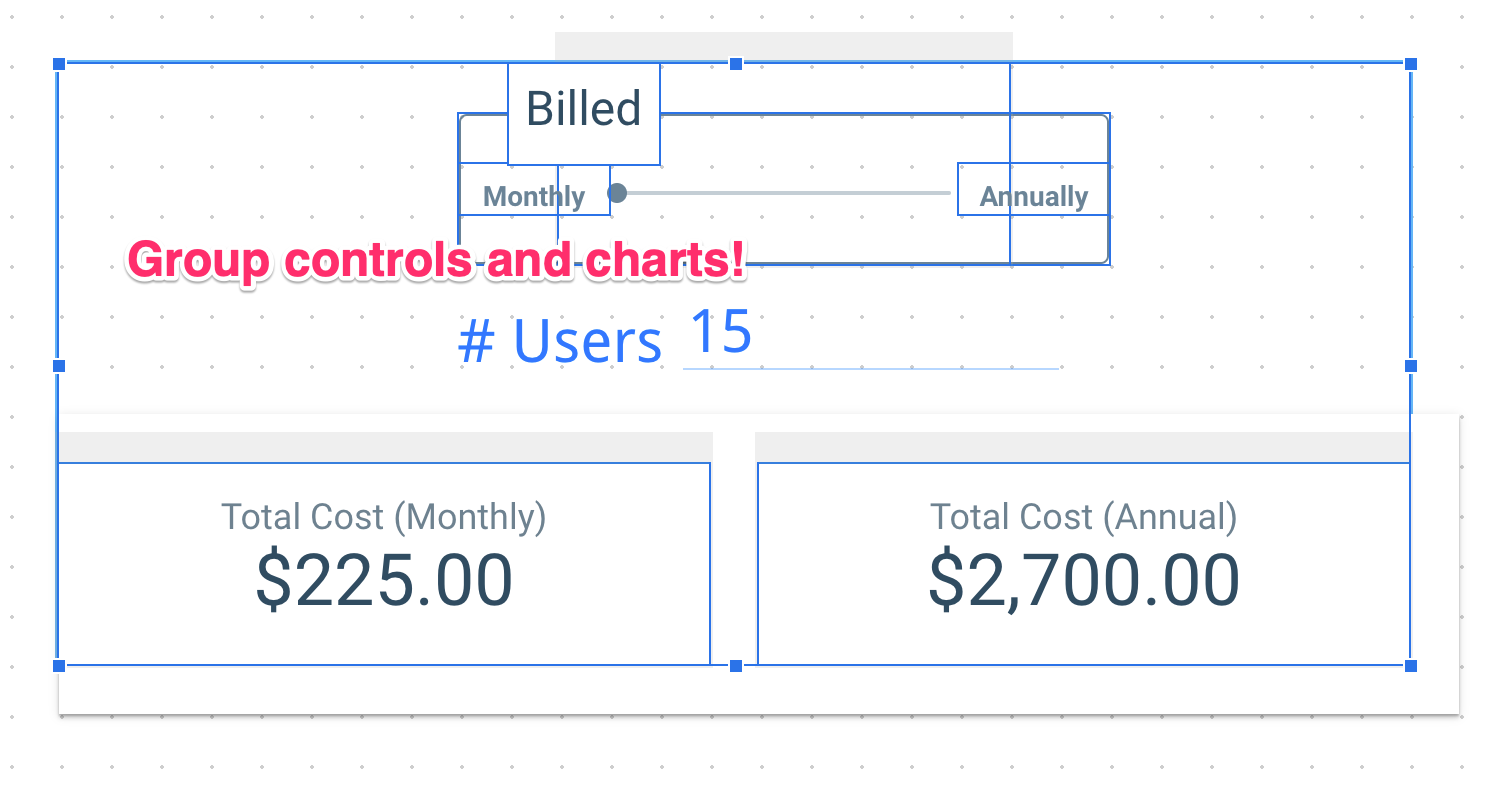
And you’re about done. You can preview the calculator using the View button to see how everything looks.
4. Embed the calculator on your site
To wrap up everything and launch the calculator on your site, it’s as simple as embedding a Google Data Studio report. We used the iframe approach to embed it on our site.
There are two steps to the embedding - making the chart (calculator) public and then generating the embed code.
To make the pricing calculator public:
- Clicking on the
Sharebutton (not the little drop down next to the button, it’s confusing) - Selecting
Manage accessand then making it public to viewers
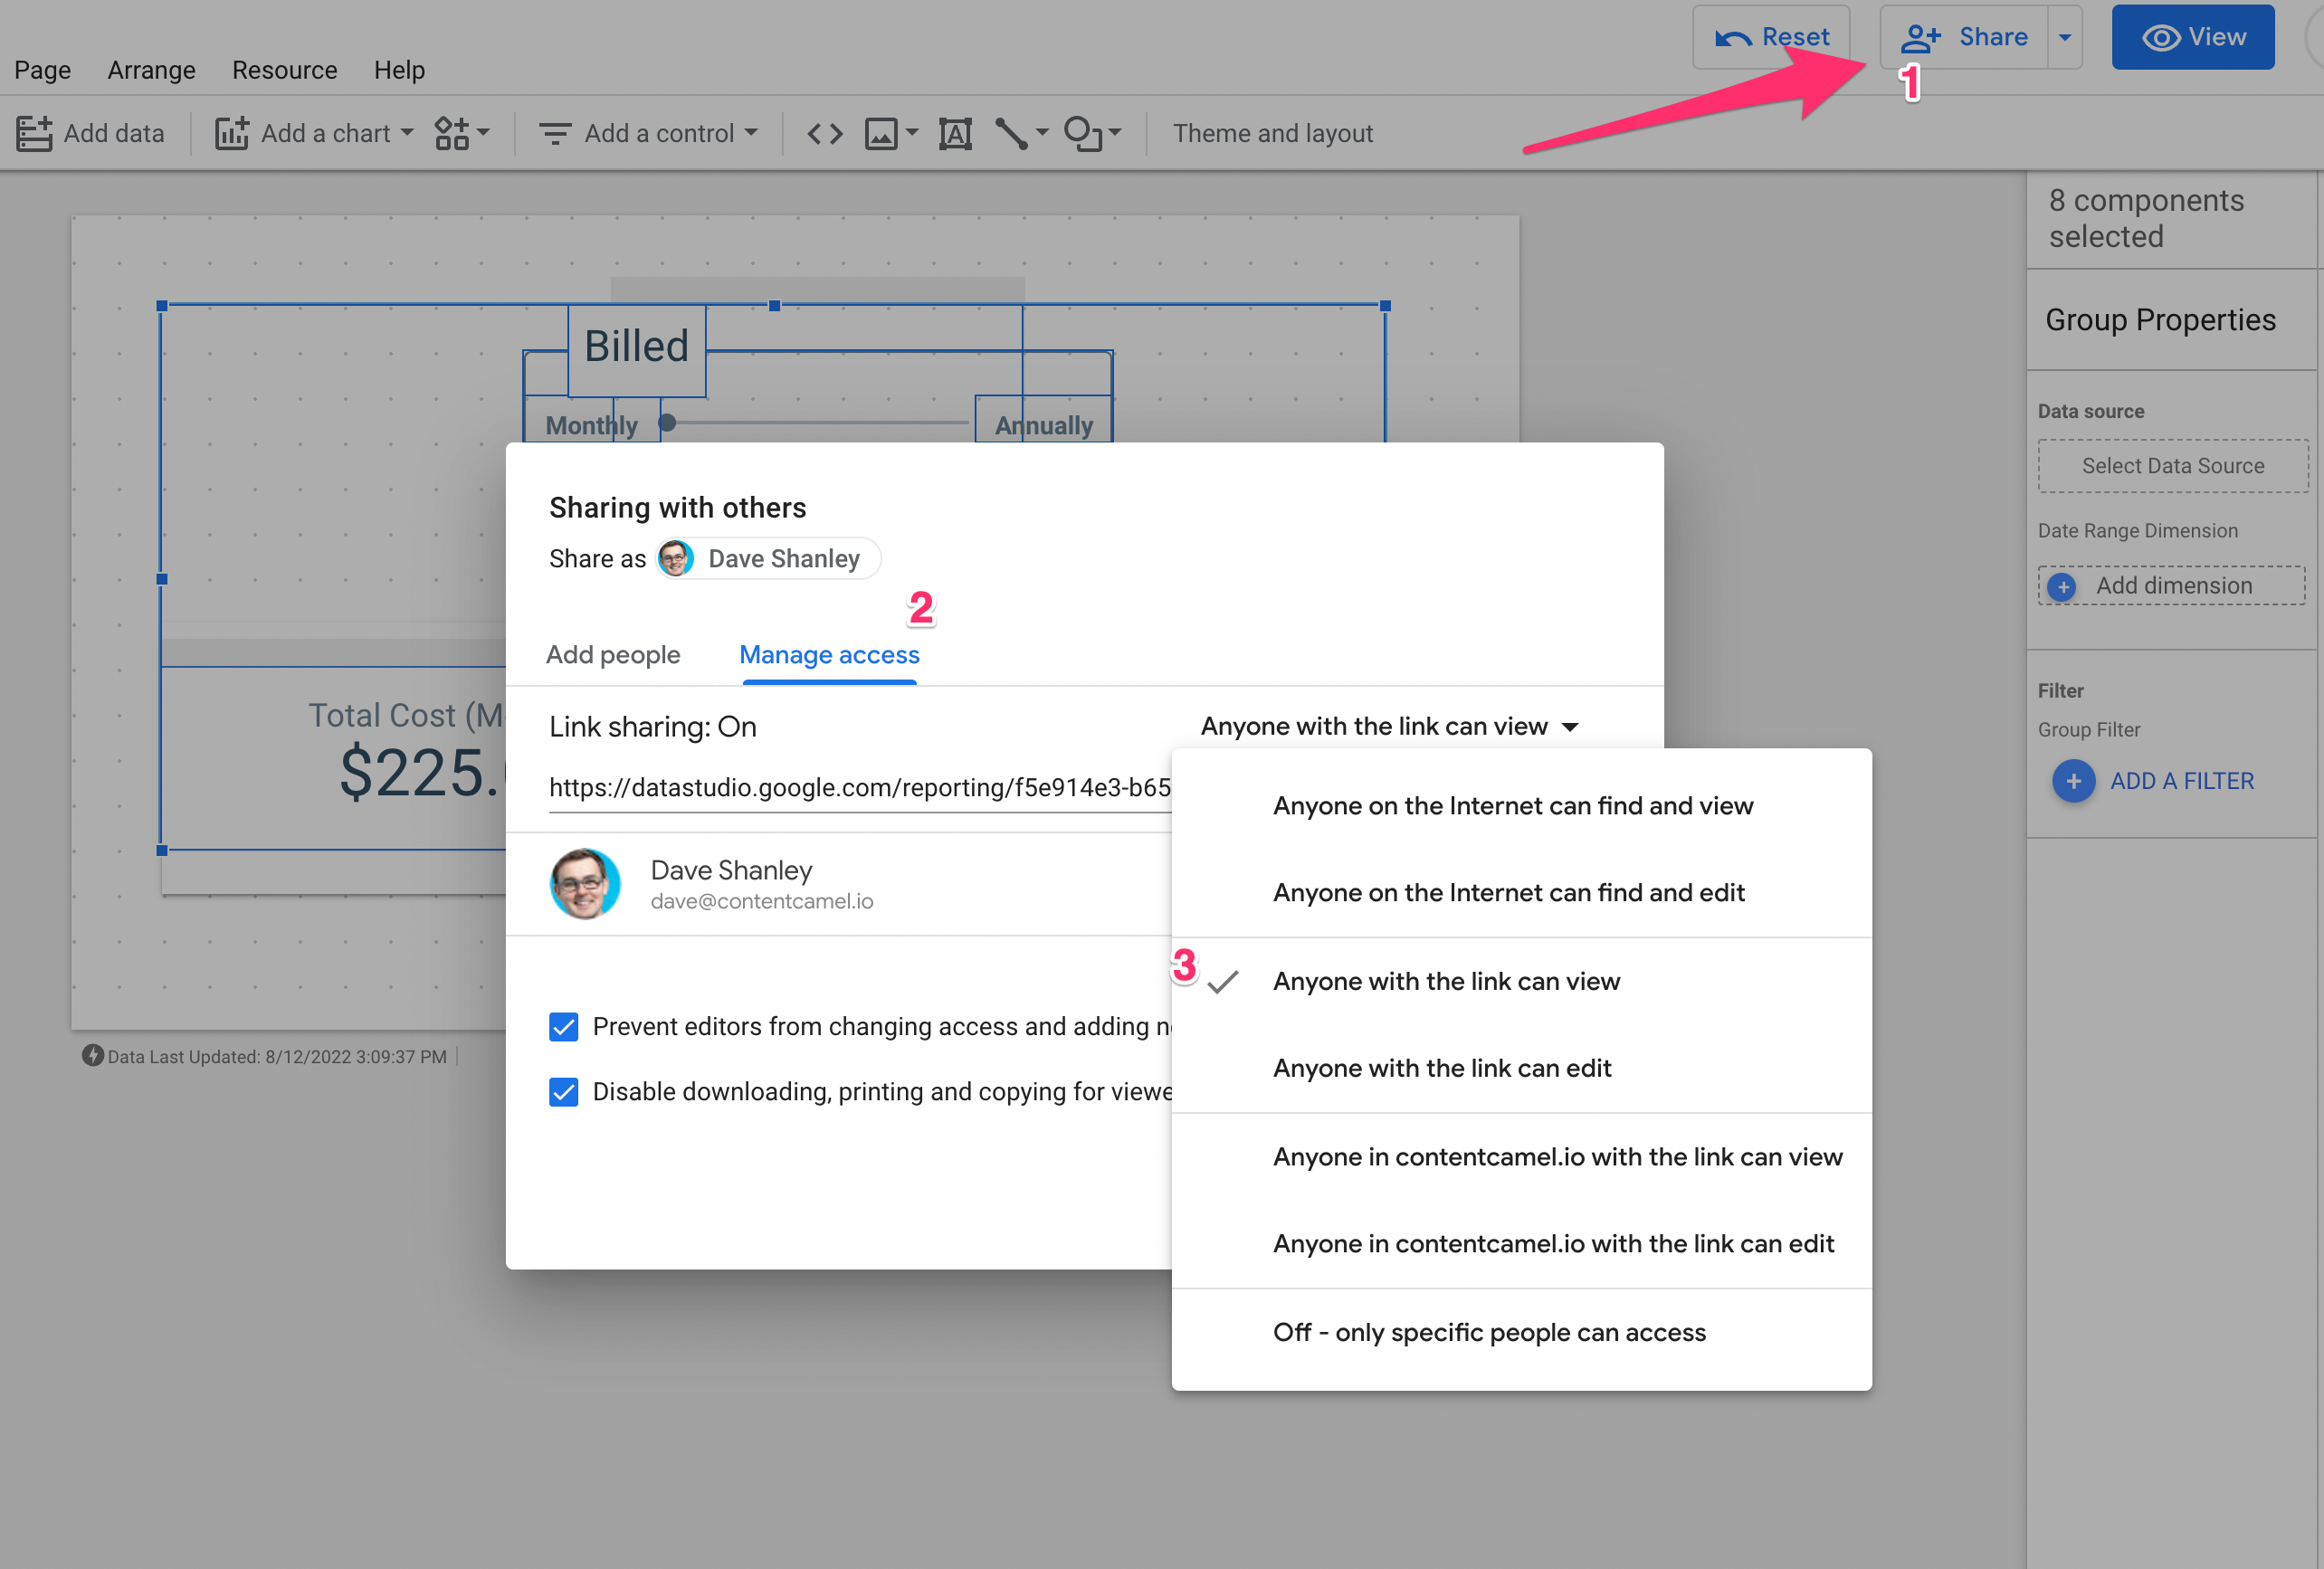
To grab the embed code to put the product pricing calculator on your website:
- Click the dropdown attached to the
Sharebutton (I know! Confusing!) - Select
Enable embeddingand copy the embed code to the clipboard
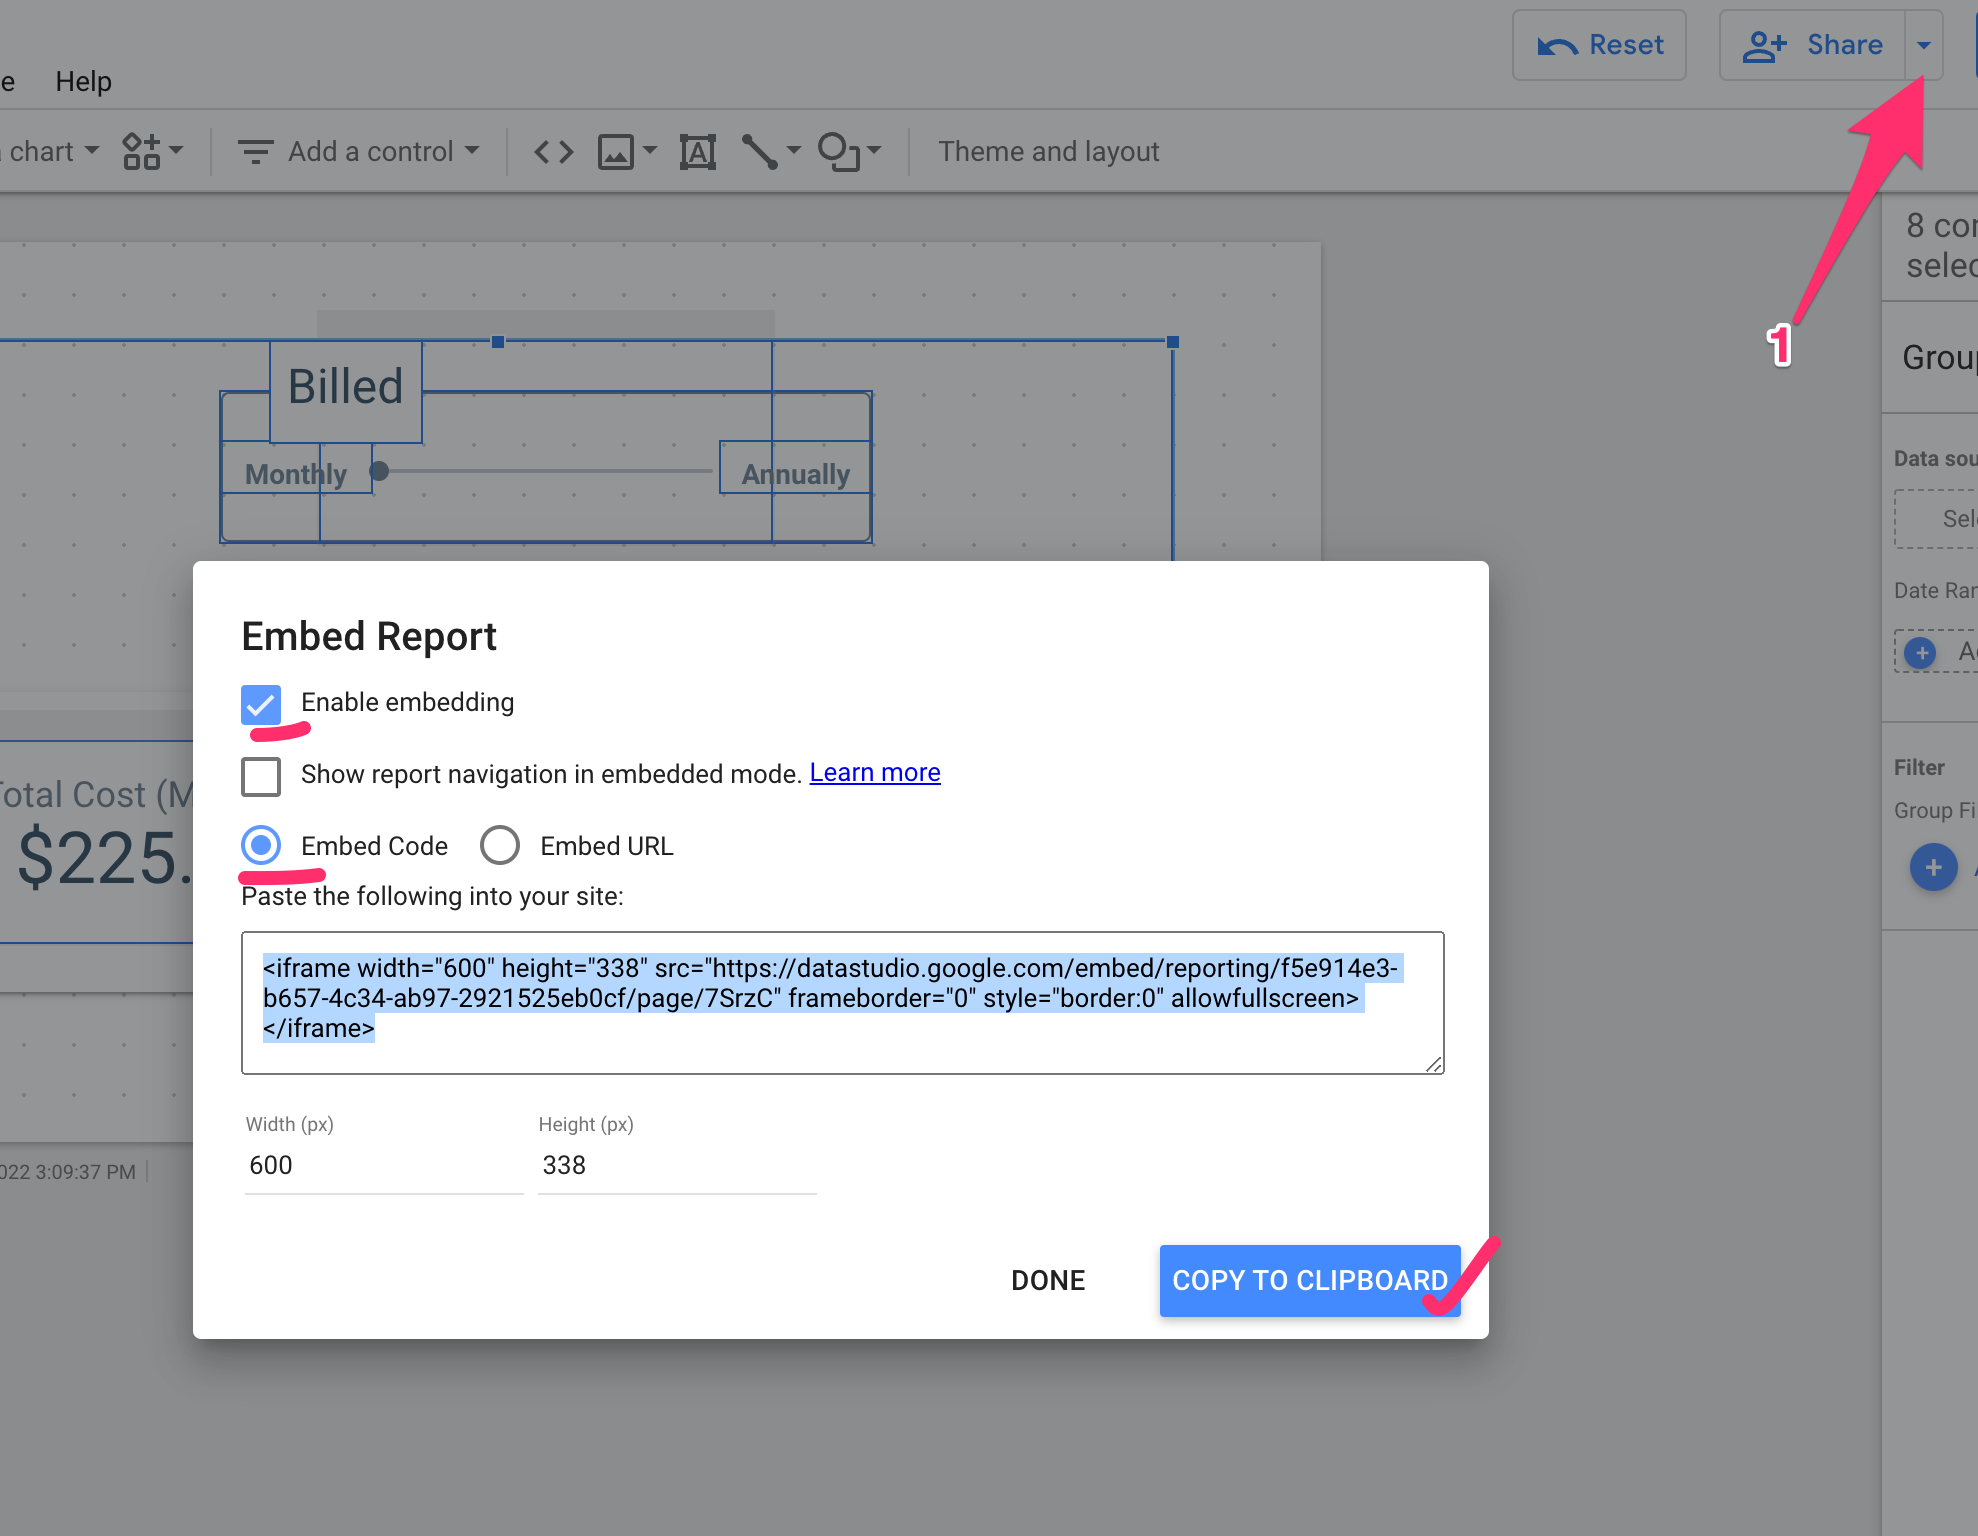
Then, it’s up to you and however you plop an iframe into your site. Common scenarios like adding an iframe to Wordpress, adding an iframe to Wix, or adding an embed block to Squarespace might be what you’re looking for 🙌